
Batumi districts: where modeled yield is higher, where living is more comfortable, and how much entry costs
Green Cape shows a 10% median modeled yield, Heroes Alley offers a more balanced investment and living profile, while Old Batumi combines the highest modeled occupancy with the highest entry price.
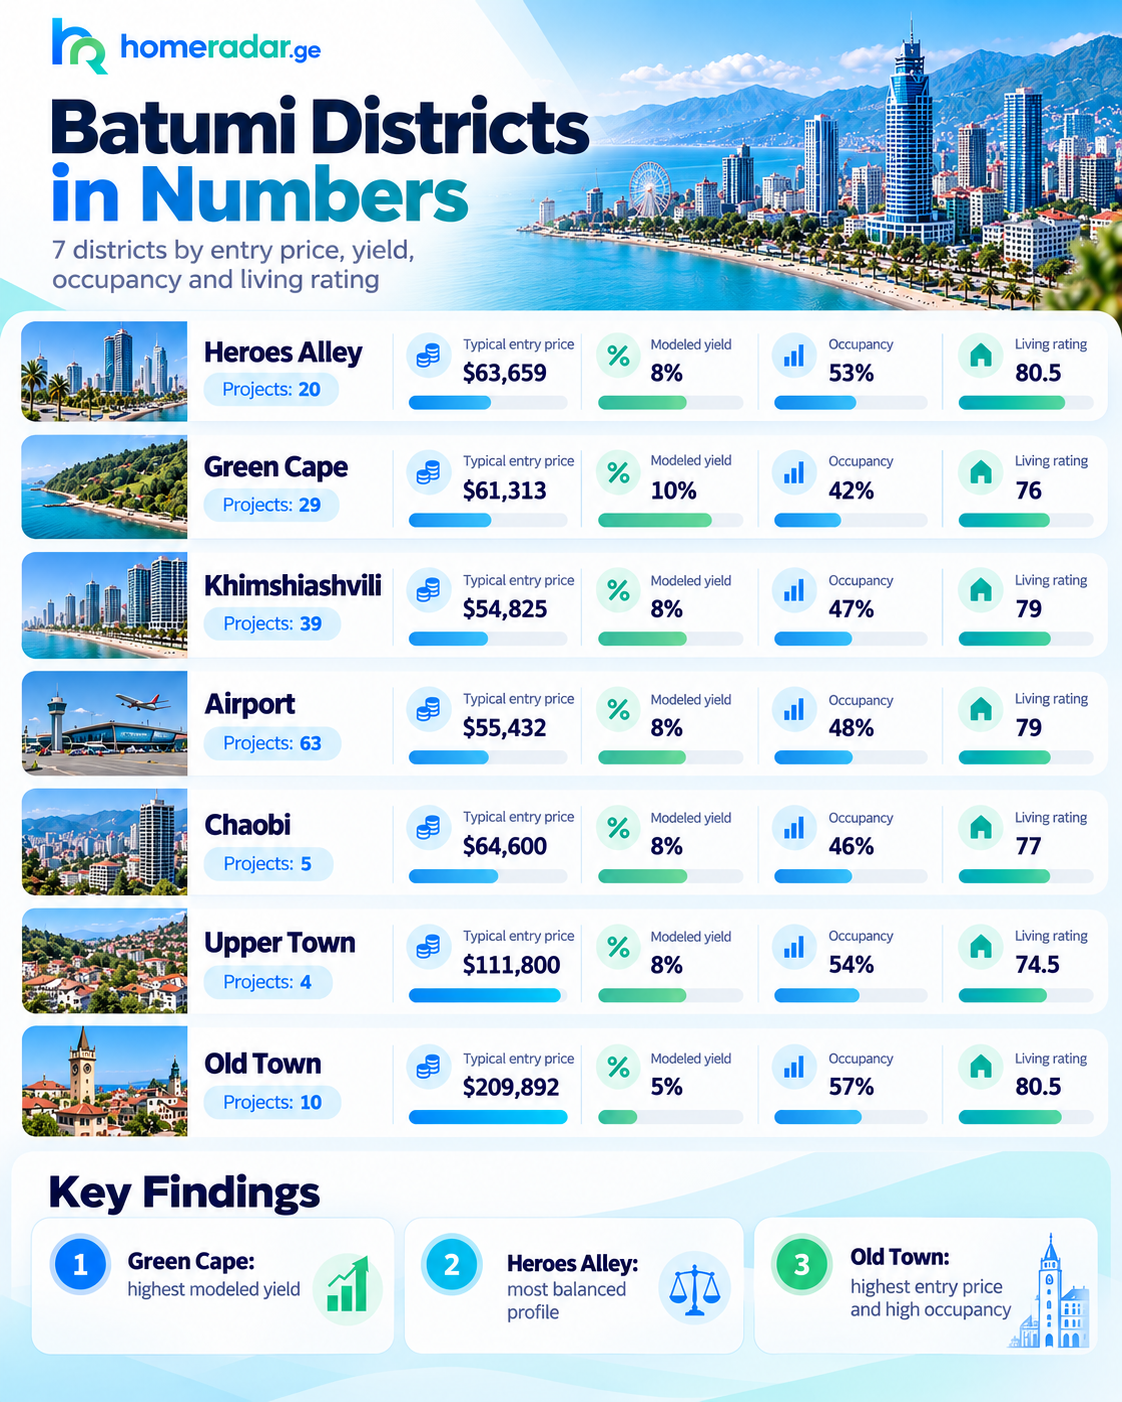
Green Cape shows the highest modeled yield among the districts in our sample: the median is 10% with a typical entry price of about $61,300. However, it trails several urban districts in modeled occupancy and indicators relevant to year-round living.
Heroes Alley offers a more even combination of investment and living indicators. Its investment rating is 66.4, living rating 80.5, modeled annual occupancy 53%, and typical property entry price about $63,700.
Old Batumi sits at the other end of the range. The typical purchase budget exceeds $209,000 and modeled yield is about 5%. Occupancy, however, reaches 57%, the highest figure among the districts in this comparison.
No single district currently leads on entry price, yield, occupancy and living comfort at the same time. The right choice depends on what the buyer plans to do with the property after purchase.
District comparison
District | Projects | Typical entry price | Modeled yield | Occupancy | Investment rating | Living rating |
20 | $63,659 | 8% | 53% | 66.4 | 80.5 | |
29 | $61,313 | 10% | 42% | 65.5 | 76 | |
39 | $54,825 | 8% | 47% | 64.1 | 79 | |
63 | $55,432 | 8% | 48% | 62.3 | 79 | |
5 | $64,600 | 8% | 46% | 63.5 | 77 | |
4 | $111,800 | 8% | 54% | 64.4 | 74.5 | |
10 | $209,892 | 5% | 57% | 57.6 | 80.5 |
Chaobi and Downtown are included in the comparison, but their samples are much smaller. Chaobi currently has five active projects and Downtown has four. These figures are useful as a current snapshot, but they do not support conclusions as robust as those for Airport, Khimshiashvili or Green Cape.
Green Cape: higher modeled yield, lower occupancy
Green Cape stands out primarily for yield. The current model shows a median of 10%, while the typical entry price is about $61,300.
In price terms, the district sits close to Heroes Alley and Chaobi and only moderately above Airport and Khimshiashvili.
The main trade-off is occupancy. It is 42%, compared with 53% in Heroes Alley, 54% in Downtown and 57% in Old Batumi.
The living rating is also lower: 76 compared with 80.5 in Heroes Alley and Old Batumi.
Green Cape therefore looks stronger for buyers who primarily see property as an income asset and are prepared to accept stronger seasonality and a less urban living scenario.
The 10% figure is a modeled net yield, not a promise of the actual return of a specific apartment.
Heroes Alley: the most even investment and living mix
Heroes Alley does not rank first on yield, but it requires less compromise between investment performance and everyday use.
The typical entry price is about $63,700. Modeled yield is 8%, occupancy 53%, investment rating 66.4 and living rating 80.5.
Heroes Alley also has one of the highest infrastructure scores, about 78.8. Khimshiashvili is around 69.4, Airport 69.1 and Green Cape 60.6.
This is where the difference between maximum yield and a more balanced purchase is particularly clear.
Buyers focused on maximizing modeled return on invested capital can find more aggressive options in Green Cape. Buyers planning to rent out the apartment while also using it themselves get a more even set of indicators in Heroes Alley.
A district rating does not mean every project in Heroes Alley is automatically better than a project elsewhere. After choosing a location, individual buildings still need to be compared.
Khimshiashvili and Airport: almost the same price, different strengths
Khimshiashvili and Airport sit in almost the same price range.
The typical entry price is about $54,800 in Khimshiashvili and $55,400 in Airport. Modeled yield is 8% in both cases.
Khimshiashvili is slightly higher on the investment rating: 64.1 versus 62.3.
Airport is notably stronger on mobility, with an average score of about 79 versus roughly 57 in Khimshiashvili.
For a buyer, this difference matters more than the few hundred dollars separating the typical entry prices. With similar budgets, the two districts offer different everyday living scenarios.
District pricing is therefore only a first filter. The next step is to compare the specific project, surroundings and intended use of the apartment.
Downtown: more expensive than most districts, but cheaper than Old Batumi
Downtown stands apart from the main group of districts.
The typical entry price is about $111,800. That is clearly above Heroes Alley, Green Cape, Khimshiashvili, Airport and Chaobi, but almost half the level of Old Batumi.
Modeled yield remains at 8%, occupancy reaches 54%, and the investment rating is 64.4.
The living rating is lower at 74.5.
Based on the current figures, Downtown looks more interesting as an urban investment scenario than as an obvious year-round living choice. The main limitation is sample size: only four active projects are currently included.
Its infrastructure score is high at about 79. The lower living rating is not only about location, because building characteristics also affect the model.
Chaobi: close to the middle on most indicators
Chaobi is in roughly the same entry-price range as Heroes Alley and Green Cape, with a typical level of $64,600.
Modeled yield is 8%, occupancy 46%, investment rating 63.5 and living rating 77.
The district currently shows no strong bias toward either yield or living. On most indicators it sits near the middle of the comparison.
There are only five active projects in the sample. That is enough to show Chaobi in the table, but not enough for broad conclusions about the district as a whole.
Old Batumi: a high entry price reduces modeled yield
Old Batumi has the highest purchase budget in the comparison, at about $209,900.
At the same time, it has the highest modeled occupancy at 57% and one of the strongest living ratings at 80.5.
Modeled yield is only 5%, while the investment rating is 57.6.
The reason is straightforward. High occupancy alone does not guarantee a high return on invested capital. The more expensive the purchase, the more net rental income is required to preserve the same percentage yield.
Old Batumi can therefore suit buyers who value a central location, their own use of the property and strong rental demand.
If the main objective is maximum modeled yield relative to purchase price, other districts currently look stronger.
Which district fits which scenario
For buyers who put modeled yield first, Green Cape currently stands out at 10% with an entry price of about $61,300.
Heroes Alley offers a more even option for those who want to combine investment with their own use.
With a budget around $55,000, Khimshiashvili and Airport are worth comparing directly. Their prices and yields are close, while the more meaningful differences appear in living characteristics.
Downtown requires roughly twice the budget of Khimshiashvili or Airport, but retains modeled yield of about 8% and occupancy of 54%. This conclusion is currently based on only four projects.
Chaobi sits in the price range of Heroes Alley and Green Cape and shows middle-of-the-range values on most indicators. A larger sample is still needed.
Old Batumi represents a different purchase scenario. The entry price is much higher and modeled yield lower, while occupancy and living indicators remain strong.
The question "which Batumi district is best" is too broad on its own. It is more useful to define the objective first: rental income, own use, or a combination of the two. The district then becomes a filter before comparing individual projects.
Method
The comparison uses active projects from current HomeRadar investment and living data.
Seven districts are included: Heroes Alley, Green Cape, Khimshiashvili, Airport, Chaobi, Downtown and Old Batumi. Projects without a defined district were excluded.
Gonio-Kvariati is not included in this article.
For purchase price, modeled yield, investment rating and living rating, the median is used for each district. This reduces the effect of individual very expensive or very cheap projects.
Occupancy is a modeled indicator. It does not mean a specific apartment will be occupied for exactly that share of the year.
Yield, investment rating and other forward-looking indicators are model estimates and do not guarantee future results.
Sample sizes differ. Airport includes 63 active projects, Khimshiashvili 39, Green Cape 29, Heroes Alley 20, Old Batumi 10, Chaobi 5 and Downtown 4. Conclusions for Chaobi and Downtown should therefore be treated more cautiously.
The data snapshot was produced on 5 October 2026. This is the date of the current snapshot, not the update date of every individual input.